GradientVisualizer
Class: maltcms.commands.fragments2d.visualization.GradientVisualizer
Workflow Slot: VISUALIZATION
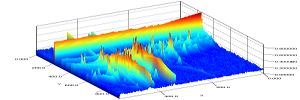
Description: (Experimental) Will visualize the similarity gradient in y direction for all modulations.
Variables
Required
var.total_intensity
var.scan_rate
var.modulation_time
var.second_column_scan_index
var.mass_values
var.intensity_values
var.scan_index
var.mass_range_min
var.mass_range_max
var.modulation_time
var.scan_rate
Optional
Provided
Configurable Properties
Name: colorramp
Default Value: res/colorRamps/bcgyr.csv
Description:
The location of the color ramp used for plotting.
Name: thresholdLow
Default Value: 0
Description:
The minimum intensity value to be included in plots.
Name: absolut
Default Value: false
Description:
If true, use similarity to fixed mass spectrum.
Name: similarity
Default Value: ArrayWeightedCosine{}
Description:
The similarity to use for gradient calculation.
Name: x
Default Value: 0
Description:
The x position of the fixed mass spectrum.
Name: y
Default Value: 0
Description:
The y position of the fixed mass spectrum.
Name: filetype
Default Value: png
Description:
The file type used for saving plots.
Name: fillValueDouble
Default Value: 9.9692099683868690e+36d
Description:
